



Q4 has historically been Bitcoin’s strongest quarter by average returns, but the distribution is wide and the exceptions are real. Understanding the pattern does not give you an edge unless you also understand what makes any given year an exception.
Q4 is the most discussed season in Bitcoin. The “Uptober” narrative has its own Wikipedia-adjacent mythology. The problem is that most commentary quotes the best years selectively and buries the exceptions. This article presents the full data, including the bad years, so you can form an honest view.
Q4 has historically been Bitcoin’s strongest quarter by average returns, but the distribution is wide and the exceptions are real. Understanding the pattern does not give you an edge unless you also understand what makes any given year an exception.
Bitcoin Q4 returns: year-by-year data (2013–2025)
| Year | Q4 BTC Return | Notes |
|---|---|---|
| 2013 | +1,750% | Parabolic bubble peak |
| 2014 | −43% | Post-Mt. Gox bear market |
| 2015 | +17% | Early recovery |
| 2016 | +58% | Pre-halving accumulation |
| 2017 | +217% | ICO bubble peak |
| 2018 | −44% | Extended bear |
| 2019 | −18% | Range-bound |
| 2020 | +168% | Institutional entry wave |
| 2021 | +7% | Late cycle, weak close |
| 2022 | −15% | FTX collapse |
| 2023 | +56% | ETF anticipation |
| 2024 | +47% | Post-halving expansion |
| 2025 | −22% | Macro correction, rate pressure |
Average Q4 return (2013–2025): approximately +172% — but the median is closer to +47%, which is the more honest central tendency given how much 2013 and 2017 distort the mean.
- Positive Q4 years: 9 out of 13 (69%)
- Negative Q4 years: 4 out of 13 (31%)
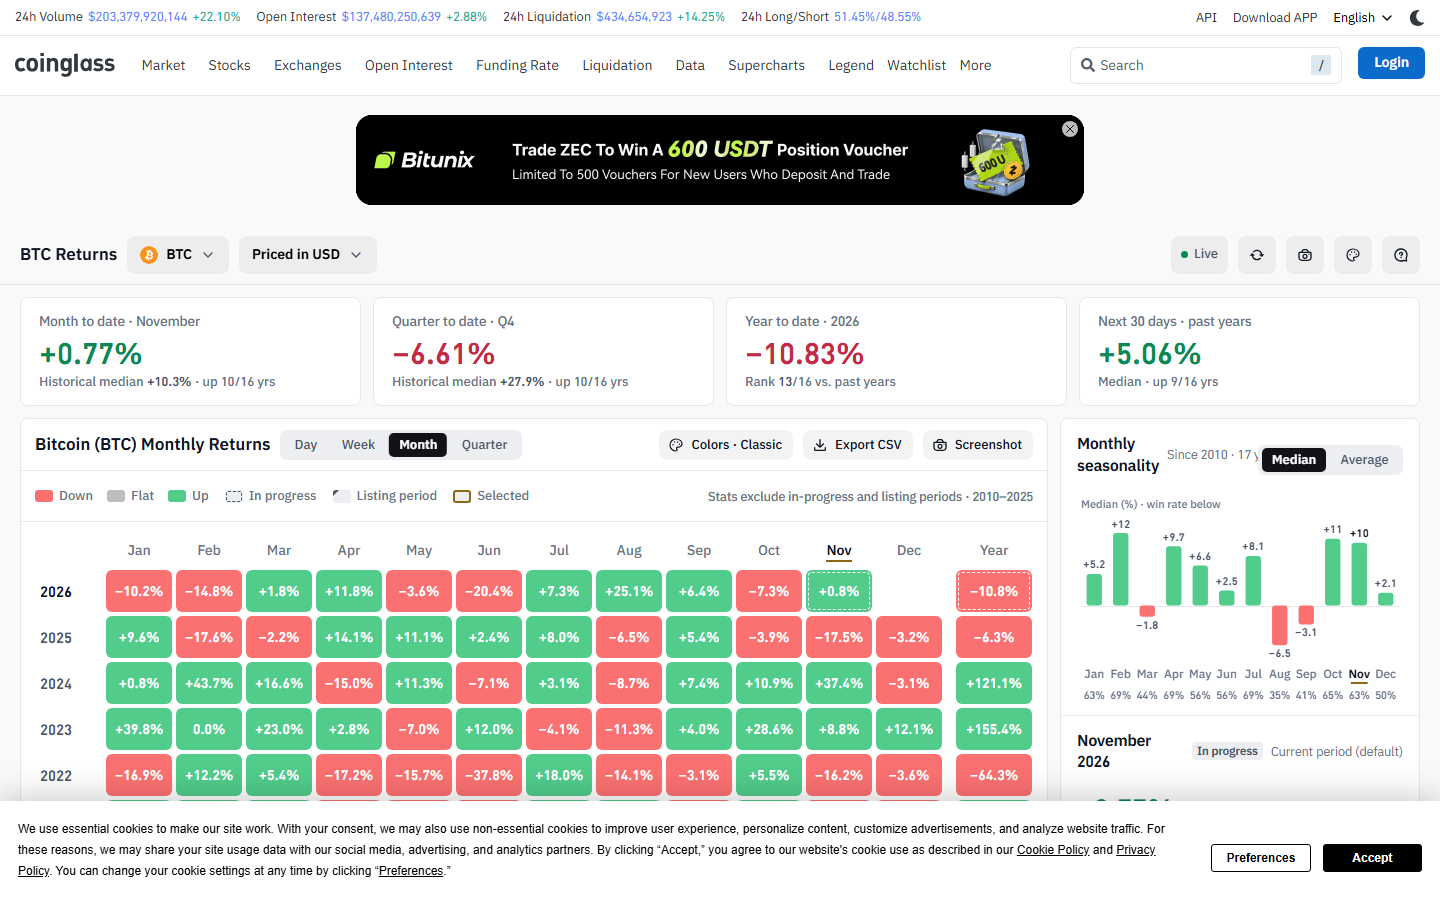
November specifically has the strongest historical sub-quarter record. Per Phemex historical data, November averaged +46% gains from 2013 to 2025 — the highest of any calendar month. October averaged +20%. December averaged a more modest +8%.
Why Q4 has historically outperformed
Year-end institutional allocation. Asset managers who underperformed their benchmarks through Q3 often add risk exposure in Q4. Bitcoin’s uncorrelated return profile made it an attractive end-of-year tactical allocation in years when the thesis was working. This effect was most visible in 2020 and 2023 when institutional buying was explicitly cited in contemporaneous disclosures.
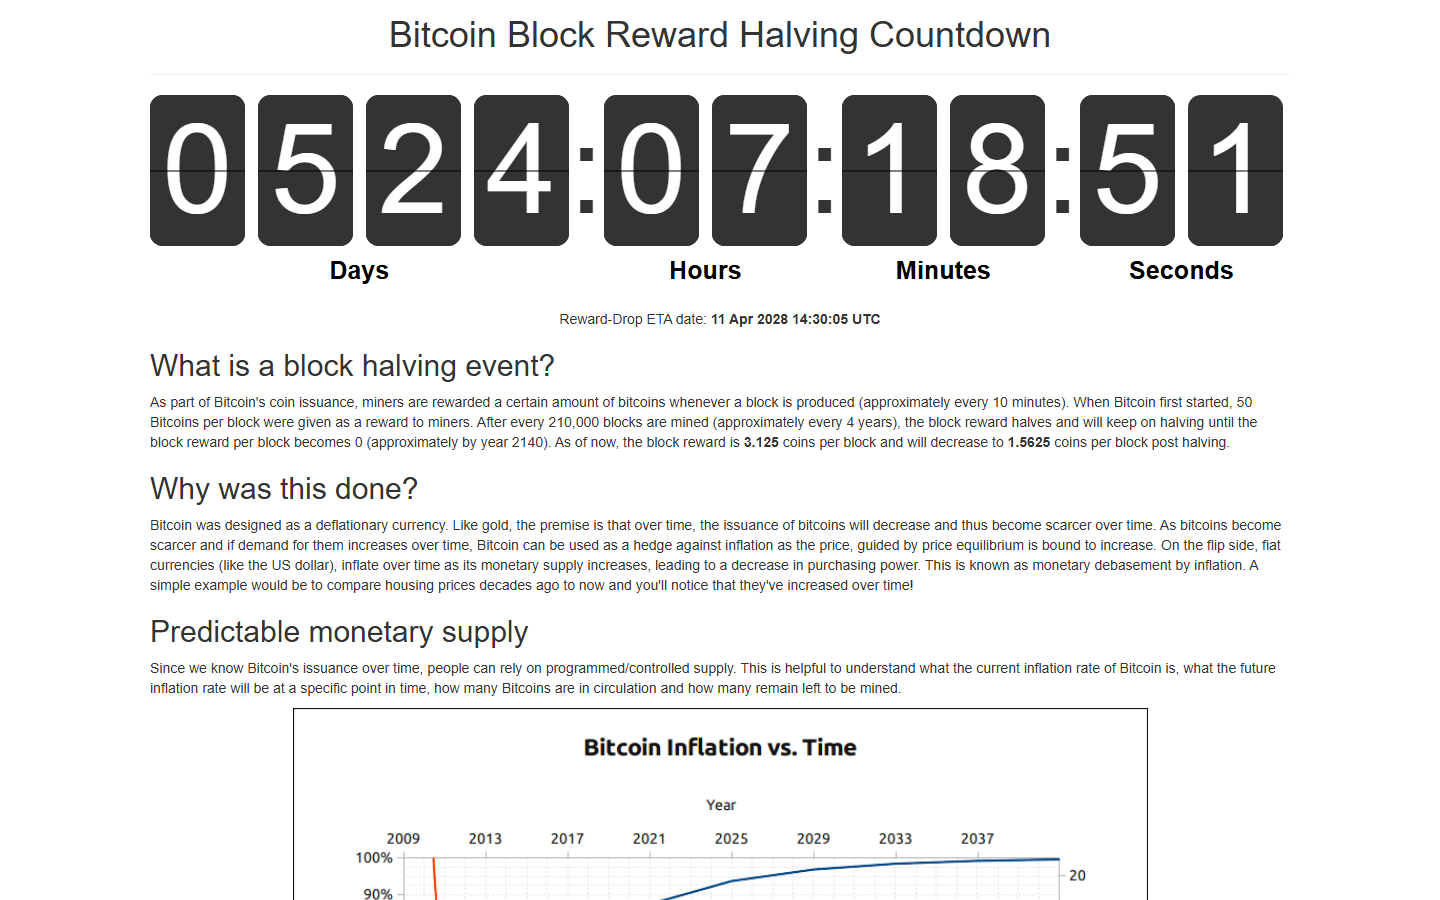
Post-halving cycle alignment. Three of Bitcoin’s four halving events occurred in Q2 (May 2020, April 2024) or Q1 (January 2012, November 2012 — the outlier). Historical cycle analysis shows that the strongest price appreciation tends to occur 12–18 months post-halving. The April 2024 halving places that window squarely in Q4 2025 through mid-2026 — though Q4 2025 was actually negative, suggesting the cycle timing thesis is weakening as a reliable predictor.
Media and retail attention cycles. Bitcoin receives disproportionate media coverage during periods of price appreciation. Strong October gains attract retail attention that compounds into November buying. This is reflexive and self-reinforcing in positive years.
The exceptions matter as much as the pattern
Any analysis that only cites the positive years is misleading. The negative Q4s are worth understanding.
2014 (−43%): Mt. Gox had collapsed earlier in the year. Trust in crypto exchanges was at a low point. The negative Q4 was the continuation of a structural confidence crisis, not seasonal underperformance.
2018 (−44%): The ICO bubble unwinding. Bitcoin dominance was falling through 2018 as altcoins collapsed. Q4 2018 included the Bitcoin Cash hash war, which created additional sell pressure.
2019 (−18%): Low conviction year. No clear narrative catalyst. Institutional interest had not yet materialized meaningfully.
2022 (−15%): FTX collapsed in November 2022. This was not seasonality failing — it was a specific fraud event that temporarily overwhelmed the calendar effect.
2025 (−22%): Macro rate pressure and profit-taking after a strong H1 2025. The post-halving cycle thesis did not materialize in Q4 2025 as cleanly as historical patterns predicted.
The common thread in negative Q4s: structural confidence events (exchange collapses, fraud) or macro forces (sustained rate pressure) that override seasonal buying patterns. In years where neither is present, the positive Q4 pattern has been more reliable.
The 2026 context: what is different this year
Q4 2026 enters with a specific set of conditions that matter for evaluating whether the historical pattern is likely to hold.
Post-Q4 2025 recovery. Q4 2025 was negative. In historical cycles, a negative Q4 has often been followed by a stronger-than-average Q4 the following year, as the corrective selling exhausted itself and the structural case for Bitcoin’s continued adoption remained intact. The sample size is small (this pattern occurred after 2014/2015 and 2019/2020), but directionally relevant.
Bitcoin ETF structural buyer base. The spot Bitcoin ETF approval in January 2024 created a persistent institutional buyer base that did not exist in earlier cycles. ETF net inflows correlate with price stability and upward pressure from systematic rebalancing. This structural change makes the Q4 pattern somewhat more reliable than in earlier cycles.
No known structural confidence threats as of October 2026. The major exchange collapses, protocol failures, and regulatory shocks of prior negative Q4s are not currently replicated by known events. That is not a guarantee — unknown risks by definition are unknown — but the absence of visible structural threats favors the positive Q4 base case.
How to use this data practically
The historical Q4 pattern is an input, not a signal. Using it mechanically — “Q4 is historically good so I should buy in October” — ignores the 31% of years that were negative and the specific conditions that made them so.
The more useful framing is conditional: if no structural confidence event occurs and macro conditions remain within the range seen in positive Q4 years, the historical pattern suggests upward bias. If either condition is violated, the pattern provides little protection.
For DCA users: the Q4 pattern does not change a dollar-cost averaging strategy. Continuing your scheduled purchases through Q4 is consistent with the long-term approach that DCA is designed for. See best bitcoin DCA apps 2026 for platform comparisons.
For investors considering lump-sum entry: the historical data supports Q4 as statistically favorable for lump-sum entry relative to other quarters, with the caveat that the negative years were significantly negative. Position sizing matters as much as timing.
For ETF holders: ETF net inflow data is a useful real-time indicator of whether institutional Q4 buying is materializing. Sustained net negative flows in October would be a warning sign that the seasonal pattern is not activating in 2026.
FAQ
Is Q4 always good for Bitcoin?
No. Q4 has been positive in approximately 69% of years since 2013, but was negative in 2014, 2018, 2019, 2022, and 2025. The negative years were associated with structural confidence events (exchange collapses, fraud) or sustained macro headwinds.
What is Bitcoin’s best month historically?
November. Historical data through 2025 shows November averaging approximately +46% returns, the highest of any calendar month. October averages approximately +20%.
Why is Q4 historically strong for Bitcoin?
Contributing factors include year-end institutional allocation behavior, Bitcoin’s historical halving cycle timing, and reflexive retail attention cycles during price appreciation periods. None of these factors are guaranteed to repeat in any given year.
What happened to Bitcoin in Q4 2025?
Q4 2025 was negative at approximately −22%, driven primarily by macro rate pressure and profit-taking after a strong H1 2025. The post-halving cycle thesis did not materialize as cleanly as historical patterns predicted.
How does the Bitcoin ETF change Q4 seasonality?
Spot Bitcoin ETFs create a persistent institutional buyer base with systematic rebalancing behavior. This structural change post-January 2024 may make Q4 buying patterns somewhat more reliable than in pre-ETF cycles, as a floor of systematic demand now exists that did not in earlier years.
Disclaimer: This article is for informational purposes only and does not constitute financial or investment advice. Cryptocurrency and digital asset markets carry significant risk. Always do your own research before making decisions.
